
Quick Take
This note changes one rule from the prior multi-asset ETF rotation study: if a selected ETF has non-positive trailing momentum, that selected slot stays in cash.
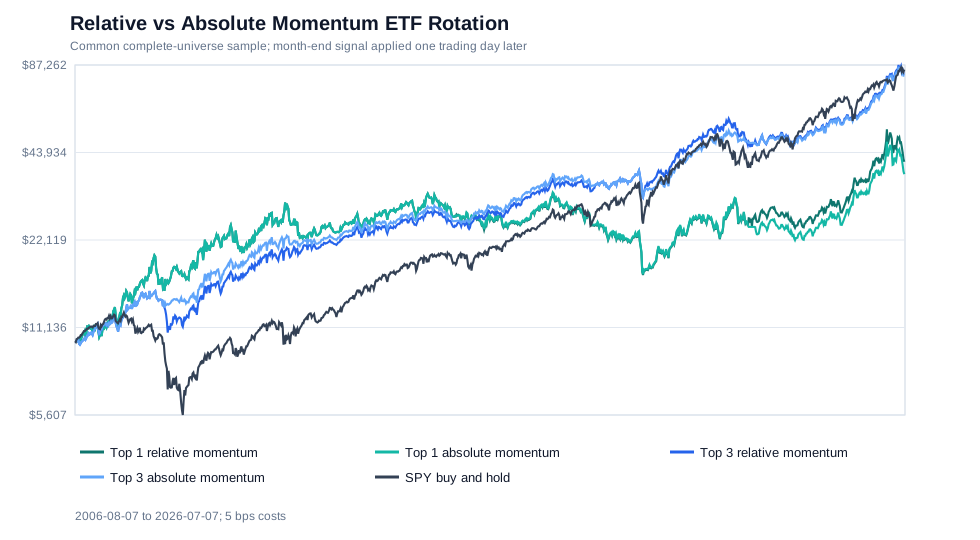
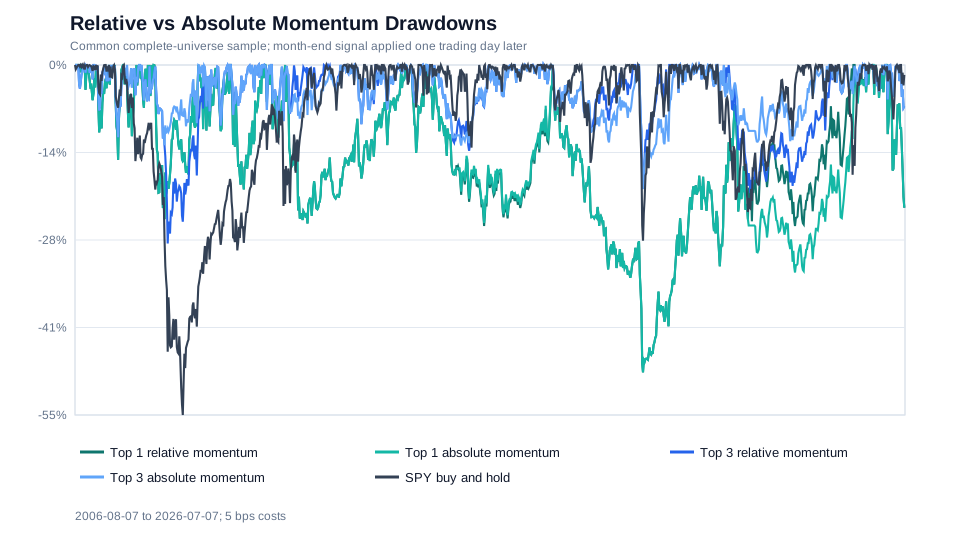
From 2006-08-07 through 2026-07-07, under the 5 bps base cost assumption, Top 3 relative momentum had a 11.19% CAGR, -28.15% maximum drawdown, and 0.38% average cash weight. Top 3 absolute momentum had a 11.11% CAGR, -23.13% maximum drawdown, and 7.82% average cash weight.
For Top 1, relative momentum had a 7.26% CAGR and -52.06% maximum drawdown. Absolute momentum had a 6.74% CAGR and -52.06% maximum drawdown. These statements describe this sample under these assumptions, not a recommendation to use either rule.
Research Question
What changes in this sample when the existing relative-momentum ETF rotation rule is modified so that selected ETFs with momentum <= 0 are not held?
Link to Prior Rotation Studies
The prior SPY, QQQ, and sector ETF momentum study and multi-asset ETF momentum study both use relative momentum. Each month they rank ETFs by trailing 126-trading-day adjusted-close return, then hold Top 1 or Top 3 after a one-trading-day delay. If every ETF has negative momentum, the relative rule still holds the highest-ranked ETF or ETFs.
This note keeps the multi-asset universe, lookback, monthly schedule, cost model, adjusted-close data, and weight-drift accounting from the multi-asset note. The only strategy-rule change is the treatment of selected assets whose trailing momentum is not positive.
Universe
| ETF | Exposure |
|---|---|
| SPY | US equities |
| EFA | Developed-market equities |
| EEM | Emerging-market equities |
| IEF | 7-10 year US Treasuries |
| GLD | Gold |
| DBC | Broad commodities |
| VNQ | US REITs |
The study uses the complete universe’s common date window. The eligible universe does not change through time.
Baseline Rule: Relative Momentum
momentum[t] = adjusted_close[t] / adjusted_close[t - 126] - 1On each calendar month’s last actual trading day, ETFs are ranked by this momentum value. Top 1 relative momentum targets 100% in the highest-ranked ETF. Top 3 relative momentum targets one-third in each of the three highest-ranked ETFs. The target weights become effective on the next trading day.
This rule is cross-sectional. It can hold ETFs with negative trailing momentum when those ETFs are still ranked inside the selected group.
Alternative Rule: Absolute Momentum
The absolute-momentum variant first uses the same ranking. Then it applies a simple cash rule:
if selected ETF momentum > 0:
    hold the selected ETF slot
else:
    hold that slot in cash
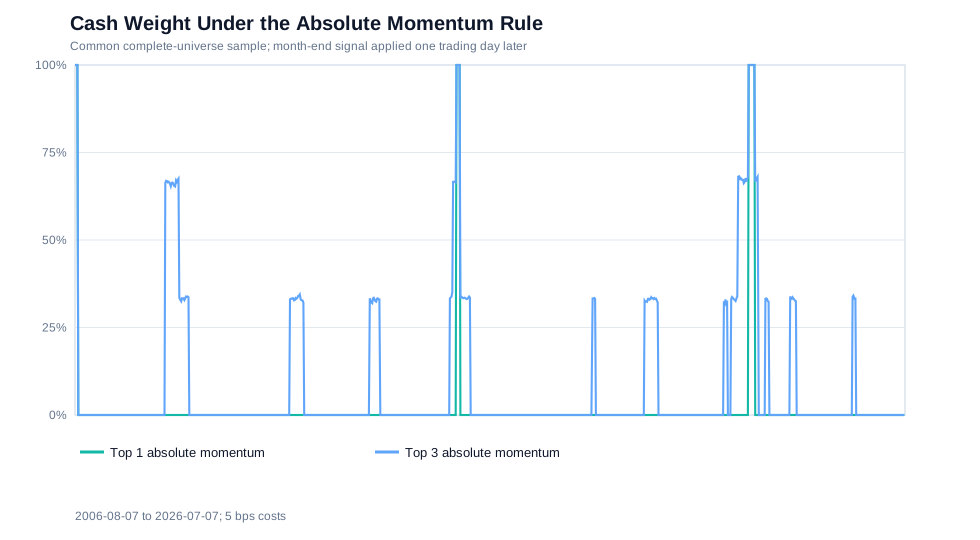
For Top 1, this means the portfolio is either 100% in the highest-ranked ETF or 100% in cash. For Top 3, each selected ETF starts with a one-third target slot. If only two selected ETFs have positive momentum, the portfolio holds those two ETFs at one-third each and cash at one-third. The remaining ETF weights are not rescaled to 100%.
Data and Assumptions
The cached source data is adjusted OHLCV from Yahoo Finance via yfinance, downloaded with yfinance using auto_adjust=True. Every portfolio uses the same inner-joined complete-universe window, then starts after the 126-trading-day warm-up. The resulting analysis window is 2006-08-07 to 2026-07-07.
Using cash return = 0% keeps this note directly comparable with the existing rotation studies. Replacing cash with BIL or SHY would add instrument-specific return, duration, fee, and inception-date effects. It can also shorten the common sample depending on the proxy chosen.
Results
| Metric | Top 1 relative | Top 1 absolute | Top 3 relative | Top 3 absolute | Equal weight | SPY |
|---|---|---|---|---|---|---|
| CAGR | 7.26% | 6.74% | 11.19% | 11.11% | 6.88% | 11.30% |
| Annualized volatility | 21.23% | 21.12% | 13.88% | 13.06% | 14.33% | 19.45% |
| Sharpe (0% rf) | 0.44 | 0.42 | 0.84 | 0.87 | 0.54 | 0.65 |
| Max drawdown | -52.06% | -52.06% | -28.15% | -23.13% | -43.63% | -55.19% |
| Calmar | 0.14 | 0.13 | 0.40 | 0.48 | 0.16 | 0.20 |
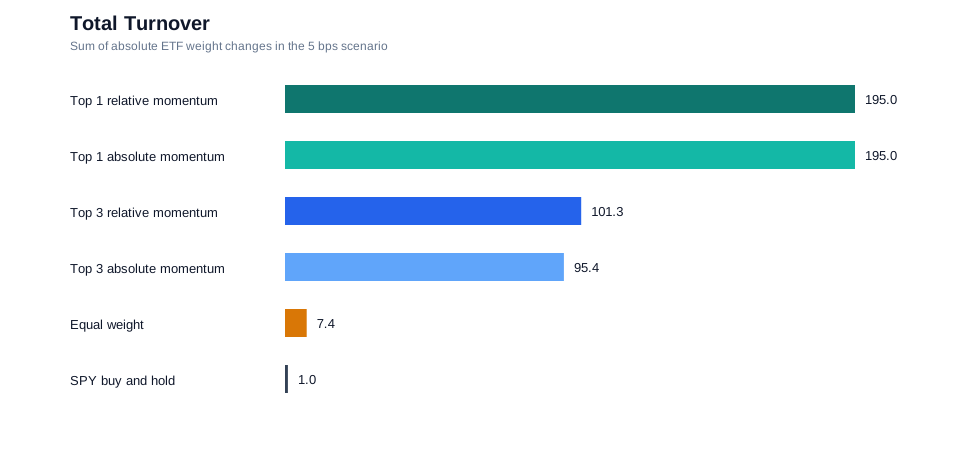
| Total turnover | 195.0 | 195.0 | 101.3 | 95.4 | 7.4 | 1.0 |
| Rebalance count | 239 | 239 | 239 | 239 | 239 | 1 |
| Average ETF holdings | 1.00 | 0.98 | 2.99 | 2.77 | 6.97 | 1.00 |
| Average cash weight | 0.38% | 1.66% | 0.38% | 7.82% | 0.38% | 0.02% |
| Final equity | $40,366 | $36,631 | $82,658 | $81,553 | $37,632 | $84,384 |
Interpretation
In this sample and under these assumptions, the absolute rule changed cash exposure more for Top 3 than for Top 1. Top 3 absolute momentum had an average cash weight of 7.82%, compared with 1.66% for Top 1 absolute momentum.
The Top 3 comparison is the clearest direct pair in this run. Top 3 relative momentum ended at $82,658 with a -28.15% maximum drawdown. Top 3 absolute momentum ended at $81,553 with a -23.13% maximum drawdown. That difference reflects this historical path, the zero-cash-return assumption, and the chosen ETF universe.
For Top 1, the absolute rule produced a lower ending value in this sample: $36,631 versus $40,366 for the relative rule. The maximum drawdown was the same to two decimal places in the base summary: -52.06% for absolute and -52.06% for relative.
Cost Sensitivity
| Portfolio | Cost | CAGR | Max drawdown | Turnover | Average cash | Final equity |
|---|---|---|---|---|---|---|
| Top 1 relative momentum | 0 bps | 7.78% | -51.34% | 195.0 | 0.38% | $44,492 |
| Top 1 relative momentum | 5 bps | 7.26% | -52.06% | 195.0 | 0.38% | $40,366 |
| Top 1 relative momentum | 10 bps | 6.73% | -52.85% | 195.0 | 0.38% | $36,618 |
| Top 1 absolute momentum | 0 bps | 7.26% | -51.34% | 195.0 | 1.66% | $40,376 |
| Top 1 absolute momentum | 5 bps | 6.74% | -52.06% | 195.0 | 1.66% | $36,631 |
| Top 1 absolute momentum | 10 bps | 6.22% | -52.78% | 195.0 | 1.66% | $33,230 |
| Top 3 relative momentum | 0 bps | 11.47% | -28.10% | 101.3 | 0.38% | $86,941 |
| Top 3 relative momentum | 5 bps | 11.19% | -28.15% | 101.3 | 0.38% | $82,658 |
| Top 3 relative momentum | 10 bps | 10.91% | -28.20% | 101.3 | 0.38% | $78,584 |
| Top 3 absolute momentum | 0 bps | 11.38% | -23.07% | 95.4 | 7.82% | $85,526 |
| Top 3 absolute momentum | 5 bps | 11.11% | -23.13% | 95.4 | 7.82% | $81,553 |
| Top 3 absolute momentum | 10 bps | 10.85% | -23.18% | 95.4 | 7.82% | $77,762 |
| Equal weight | 0 bps | 6.90% | -43.61% | 7.4 | 0.38% | $37,772 |
| Equal weight | 5 bps | 6.88% | -43.63% | 7.4 | 0.38% | $37,632 |
| Equal weight | 10 bps | 6.86% | -43.65% | 7.4 | 0.38% | $37,492 |
| SPY buy and hold | 0 bps | 11.31% | -55.19% | 1.0 | 0.02% | $84,426 |
| SPY buy and hold | 5 bps | 11.30% | -55.19% | 1.0 | 0.02% | $84,384 |
| SPY buy and hold | 10 bps | 11.30% | -55.19% | 1.0 | 0.02% | $84,341 |
The cost scenarios are 0, 5, and 10 bps per unit of ETF turnover. A move from cash to a fully invested ETF has turnover 1. A complete ETF-to-ETF switch has turnover 2. Cash itself is not charged a return, and the cost model omits taxes, spreads beyond the stated assumption, and market impact.
At 0 bps, Top 3 relative momentum had a 11.47% CAGR and Top 3 absolute momentum had a 11.38% CAGR. At 10 bps, the corresponding figures were 10.91% and 10.85%. These are cost-scenario outputs, not a parameter search.
Comparison With Prior Rotation Studies
The two earlier rotation notes use relative momentum as their baseline. This note keeps the multi-asset setup from the second study and places the relative and absolute variants in the same result table:
| Variant | Relative CAGR | Absolute CAGR | Relative max drawdown | Absolute max drawdown | Relative avg cash | Absolute avg cash |
|---|---|---|---|---|---|---|
| Top 1 | 7.26% | 6.74% | -52.06% | -52.06% | 0.38% | 1.66% |
| Top 3 | 11.19% | 11.11% | -28.15% | -23.13% | 0.38% | 7.82% |
This table isolates the rule change more directly than comparing against the sector-rotation article, because the sector article uses a different universe. The sector study remains useful context for relative momentum inside US equities, while this note focuses on the multi-asset ETF universe.
Limitations
This is one historical sample with one ETF universe, one lookback, and one monthly rebalance schedule. The universe itself reflects availability and selection choices. DBC introduces commodity futures roll, collateral, fee, and fund-structure effects. IEF has duration exposure.
Yahoo Finance adjusted data can change after vendor revisions. Adjusted close is not an executable closing price, and the next-trading-day implementation is still a close-to-close approximation rather than an explicit next-open fill. Dividends, splits, and fund distributions are handled through adjusted data, so any adjustment error affects the backtest.
Cash return is fixed at 0%. That understates cash returns in positive short-rate periods and overstates them in periods when cash-like net returns would be negative after fees. It is used here for comparability with the existing rotation notes, not as a claim about investable cash management.
The analysis does not imply future returns. It only reports how these rules behaved in this sample under these assumptions.
Reproduce
cd studies/relative-vs-absolute-momentum-etf-rotation
pip install -r requirements.txt
python3 -B -m unittest discover -s . -p "test_*.py"
python3 backtest.py
python3 plot.py
The output includes a summary CSV, daily equity/audit CSV, rebalance trade log, and four SVG charts. The daily CSV includes adjusted closes, momentum values, target weights, pre-trade drifted weights, actual weights, ETF returns, cash weights, turnover, costs, equity, and drawdown.
FAQ
Is this recommending absolute momentum?
No. The note tests a rule change: selected ETFs with non-positive trailing momentum are not held. The results are historical and assumption-specific.
Does Top 3 absolute momentum rescale the remaining ETFs?
No. If the Top 3 selected group has only two ETFs with positive momentum, each keeps a one-third target weight and the remaining one-third stays in cash.
Why use cash return = 0%?
It keeps the comparison close to the existing rotation notes. A short-duration ETF proxy would add a second asset-return assumption and may shorten the common sample.
Can the relative rule hold negative-momentum ETFs?
Yes. Relative momentum ranks the universe cross-sectionally. If the selected ETF is less negative than the others, the relative rule can still hold it.
Does the signal use same-day information?
No. Month-end targets are calculated after the month-end close and become effective on the next trading day.
More notes
Monthly Contributions in SPY, QQQ, and ETF Portfolios
A reproducible monthly contribution backtest comparing SPY, QQQ, a 60/40 stock-bond portfolio, and a simple multi-asset ETF portfolio using adjusted-close data.
Monthly QQQ Contributions Through the Dot-Com Crash
A reproducible backtest of monthly QQQ contributions starting in 2000, compared with SPY contributions and QQQ's dot-com price recovery path.