
Quick Take
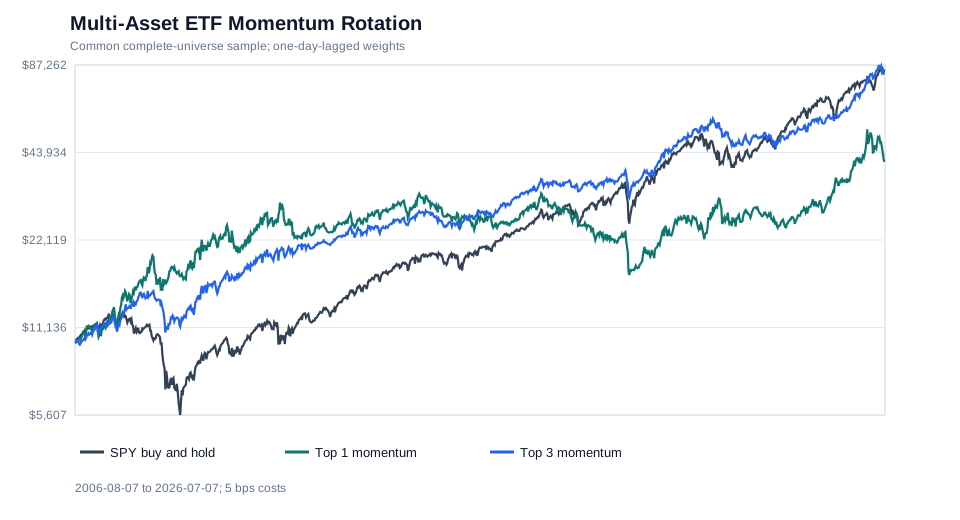
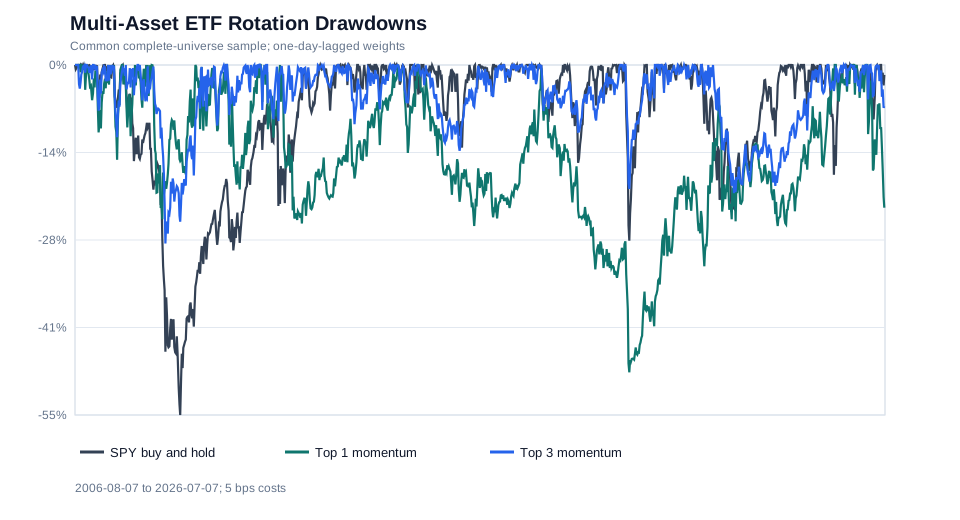
From 2006-08-07 through 2026-07-07, monthly Top 3 cross-asset momentum produced a 11.19% CAGR and -28.15% maximum drawdown after 5 bps per unit of turnover. SPY buy and hold produced 11.30% and -55.19%. In this sample, Top 3 had a lower CAGR and a smaller maximum drawdown than SPY.
Top 1 had a 7.26% CAGR and a -52.06% maximum drawdown. These figures apply only to this sample and these assumptions.
Research Question
How did monthly Top 1 and Top 3 cross-asset momentum compare with SPY buy and hold over the same period?
Asset Universe
| ETF | Exposure |
|---|---|
| SPY | US equities |
| EFA | Developed-market equities |
| EEM | Emerging-market equities |
| IEF | 7–10 year US Treasuries |
| GLD | Gold |
| DBC | Broad commodities |
| VNQ | US REITs |
IEF is used instead of TLT so the result is less dependent on long-duration Treasury risk. It still has meaningful duration exposure. DBC is used instead of PDBC because DBC has the longer history required for this common-window study. DBC’s futures roll, collateral, fees, and fund structure remain limitations; a different commodity vehicle can change results.
Data
The cached input is adjusted OHLCV from Yahoo Finance via yfinance. Every strategy uses the inner-joined dates on which all seven ETFs have valid prices. The 126-day warm-up is then applied to the complete universe, producing the common analysis window 2006-08-07 to 2026-07-07. Missing assets never dynamically change the eligible pool.
Momentum Definition
momentum[t] = adjusted_close[t] / adjusted_close[t - 126] - 1On each calendar month’s last actual trading day, Top 1 selects the highest-ranked ETF and Top 3 selects the highest-ranked three at equal target weights. This is cross-sectional relative momentum only: even when every momentum value is negative, the highest-ranked assets are selected. Exact ties are resolved by the fixed universe order SPY, EFA, EEM, IEF, GLD, DBC, VNQ.
Rebalance and Execution Timing
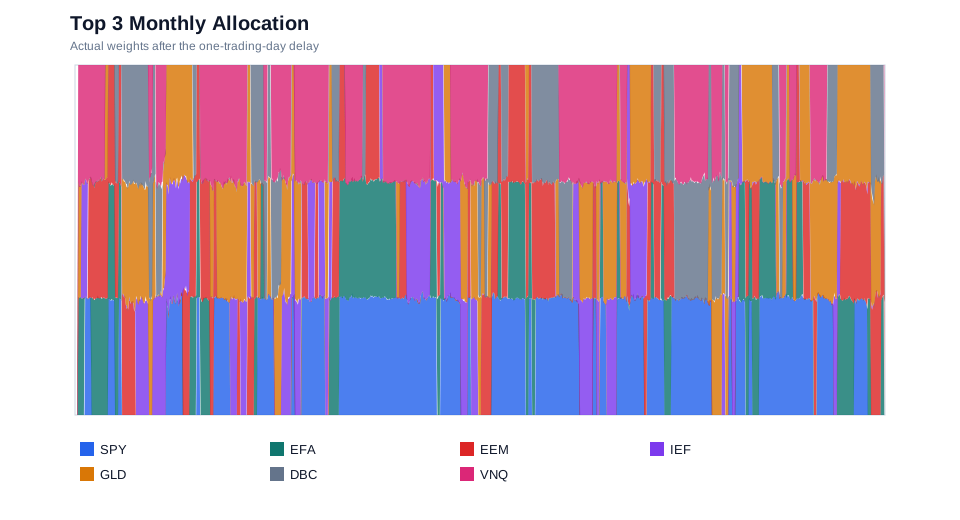
Targets are calculated after the month-end close and become effective one trading day later. Before the first valid month-end signal, the rotation portfolios hold cash. Between rebalances, weights drift with asset returns; on an effective rebalance date they are reset to the new target.
SPY buy and hold makes one delayed initial purchase and pays its initial-entry cost.
Costs
turnover[t] = sum(abs(weight_after_trade[t] - weight_before_trade[t]))
cost[t] = turnover[t] * cost_bps / 10000
Moving from cash to fully invested has turnover 1. A complete switch from one ETF to another has turnover 2. The study tests 0, 5, and 10 bps; 5 bps is the base case used in the charts and main table.
Results
| Metric | Top 1 | Top 3 | SPY |
|---|---|---|---|
| CAGR | 7.26% | 11.19% | 11.30% |
| Annualized volatility | 21.23% | 13.88% | 19.45% |
| Sharpe (0% rf) | 0.44 | 0.84 | 0.65 |
| Max drawdown | -52.06% | -28.15% | -55.19% |
| Calmar | 0.14 | 0.40 | 0.20 |
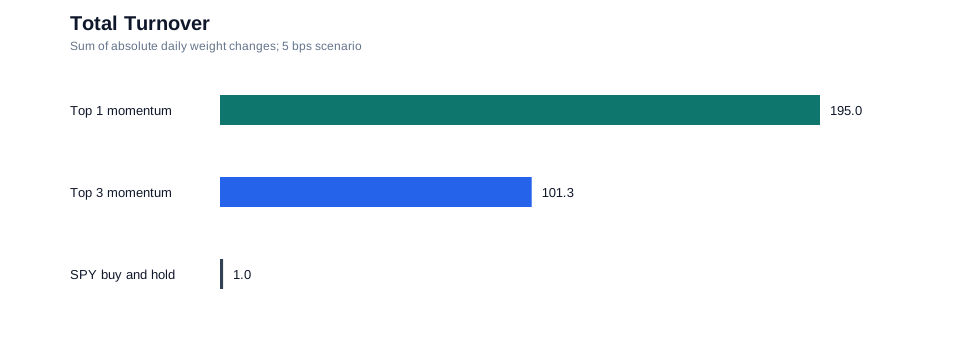
| Total turnover | 195.0 | 101.3 | 1.0 |
| Rebalance count | 239 | 239 | 1 |
| Average holdings | 1.00 | 2.99 | 1.00 |
| Final equity | $40,366 | $82,658 | $84,384 |
Interpretation
Top 3 had the highest Sharpe ratio among the three primary portfolios in this sample: 0.84, compared with 0.65 for SPY. Its ending value was $82,658 versus $84,384 for SPY. Its maximum drawdown was -28.15% versus -55.19% for SPY.
Top 1 had total turnover of 195.0 and a 7.26% CAGR. Top 3 and SPY had CAGRs of 11.19% and 11.30%, respectively.
Diversification Control: Equal Weight
Equal weight is a secondary benchmark, not a momentum strategy. It holds all
seven ETFs. At each monthly rebalance, every ETF is reset to 1/7, or about
14.29%. The weights then drift with returns until the next rebalance.
This control helps separate the effect of momentum selection from the effect of simply diversifying across stocks, Treasuries, gold, commodities, and REITs. At the 5 bps base cost, equal weight had a 6.88% CAGR, a -43.63% maximum drawdown, a 0.54 Sharpe ratio, and final equity of $37,632. Its total two-sided turnover was 7.4 over the full sample.
Transaction-Cost Sensitivity
| Portfolio | Cost | CAGR | Max drawdown | Turnover | Final equity |
|---|---|---|---|---|---|
| Top 1 momentum | 0 bps | 7.78% | -51.34% | 195.0 | $44,492 |
| Top 1 momentum | 5 bps | 7.26% | -52.06% | 195.0 | $40,366 |
| Top 1 momentum | 10 bps | 6.73% | -52.85% | 195.0 | $36,618 |
| Top 3 momentum | 0 bps | 11.47% | -28.10% | 101.3 | $86,941 |
| Top 3 momentum | 5 bps | 11.19% | -28.15% | 101.3 | $82,658 |
| Top 3 momentum | 10 bps | 10.91% | -28.20% | 101.3 | $78,584 |
| SPY buy and hold | 0 bps | 11.31% | -55.19% | 1.0 | $84,426 |
| SPY buy and hold | 5 bps | 11.30% | -55.19% | 1.0 | $84,384 |
| SPY buy and hold | 10 bps | 11.30% | -55.19% | 1.0 | $84,341 |
Transaction costs reverse the CAGR ranking between Top 3 and SPY. At 0 bps, Top 3 had a CAGR of 11.47% versus 11.31% for SPY. At 5 bps, Top 3 had 11.19% versus 11.30% for SPY; at 10 bps, the figures were 10.91% and 11.30%. This is a narrow cost sensitivity; the 126-day lookback, universe, and monthly schedule are not parameter sweeps.
Comparison with Sector ETF Rotation
The SPY, QQQ, and sector ETF momentum study rotates within US equities. This study rotates across equity regions, intermediate Treasuries, gold, commodities, and REITs. Sector rotation changes exposure inside a common equity risk family; cross-asset rotation can move between materially different economic risks.
The published sector study starts earlier, while DBC and the 126-trading-day warm-up determine this study’s later start. Comparing the two full samples would therefore mix strategy differences with period differences. The table below reads the old study’s cached ETF prices and recalculates sector Top 1 and Top 3 with the same accounting used here: weights drift between rebalances, turnover is measured against pre-trade drifted weights, and month-end targets take effect one trading day later. It does not slice or reuse the old article’s published strategy returns.
Both universes are rebased to $10,000 over the shared 2006-08-07–2026-07-07 window, remain in cash until their first shared-window month-end signal becomes effective, and apply the base cost of 5 bps. Momentum uses price history before the shared start for the 126-trading-day warm-up.
| Portfolio | CAGR | Volatility | Sharpe | Max drawdown | Final equity |
|---|---|---|---|---|---|
| Cross-asset Top 1 | 7.26% | 21.23% | 0.44 | -52.06% | $40,366 |
| Sector Top 1 | 9.24% | 22.67% | 0.50 | -58.76% | $58,099 |
| Cross-asset Top 3 | 11.19% | 13.88% | 0.84 | -28.15% | $82,658 |
| Sector Top 3 | 9.78% | 18.64% | 0.59 | -50.49% | $64,095 |
| SPY buy and hold | 11.30% | 19.45% | 0.65 | -55.19% | $84,384 |
Over this common window, cross-asset Top 3 had a CAGR of 11.19% versus 9.78% for sector Top 3. Their maximum drawdowns were -28.15% and -50.49%, respectively. Cross-asset Top 1 had a lower CAGR and a smaller maximum drawdown than sector Top 1. SPY had a CAGR of 11.30%.
Limitations
This is a single historical universe with survivorship and selection bias. ETF adjusted closes are not executable closing prices, and the next-day implementation is a close-to-close approximation rather than a next-open fill. Cash earns 0%, which understates cash returns when short rates are positive. Costs exclude taxes and market impact. IEF reduces but does not remove duration dependence; DBC introduces futures-roll and fund-structure effects. The fixed 126-day lookback and monthly frequency may be sample-specific. No absolute-momentum filter is present, so the strategy remains invested in the least-bad assets when all momentum is negative.
Reproduce
cd studies/multi-asset-etf-momentum-rotation-backtest
pip install -r requirements.txt
python3 -B -m unittest discover -s . -p "test_*.py"
python3 backtest.py
python3 plot.py
The repository contains seven cached source CSVs, a summary CSV, a daily audit CSV with prices, momentum, target weights, pre-trade drifted weights, post-trade actual weights, returns, costs, equity, and drawdown, a rebalance trade log, and four SVG charts. The common-window comparison also reads the sibling sector study’s cached price files.
FAQ
What happens when all seven ETFs have negative momentum?
The strategy still holds the highest-ranked one or three ETFs. There is no cash filter.
Is the signal used at the same month-end close?
No. The target is computed after that close and applied one trading day later.
Why IEF rather than TLT?
IEF reduces reliance on long-duration Treasury risk, though it does not eliminate interest-rate risk.
Why DBC rather than PDBC?
DBC provides a longer history and therefore a longer common sample. Its structure and roll behavior are part of the result and limit generalization.
Did momentum beat SPY?
Not cleanly. At 5 bps, Top 3 had a slightly lower CAGR and ending value than SPY but a much shallower maximum drawdown. Top 1 lagged SPY substantially.
More notes
Monthly Contributions in SPY, QQQ, and ETF Portfolios
A reproducible monthly contribution backtest comparing SPY, QQQ, a 60/40 stock-bond portfolio, and a simple multi-asset ETF portfolio using adjusted-close data.
Monthly QQQ Contributions Through the Dot-Com Crash
A reproducible backtest of monthly QQQ contributions starting in 2000, compared with SPY contributions and QQQ's dot-com price recovery path.