
Quick Take
This note starts monthly QQQ contributions near the dot-com bubble period. From 2000-01-03 through 2026-07-07, the account invests $500 on each month’s first trading day. Total contributions were $159,500.
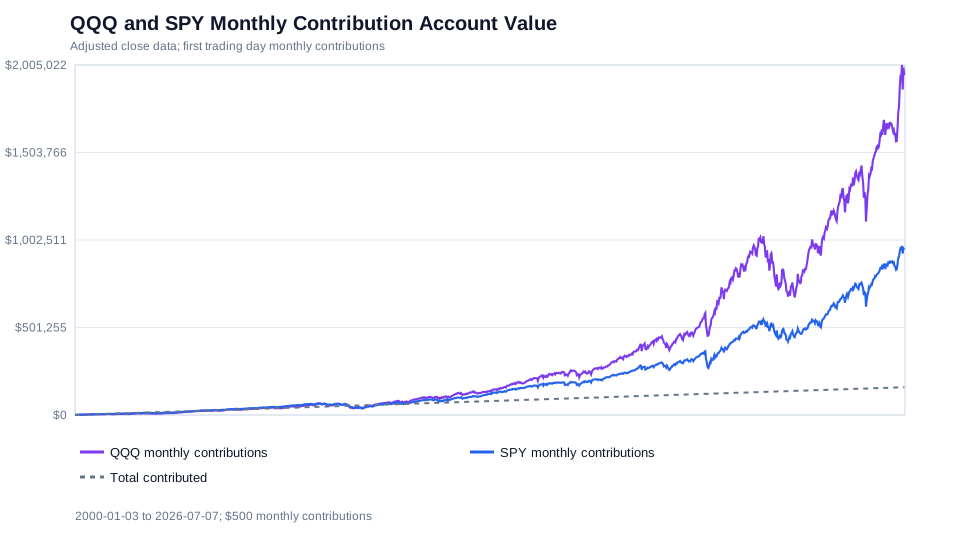
In this sample, the QQQ monthly contribution account ended at $1,908,908 with a 15.62% money-weighted return. The SPY monthly contribution account, using the same contribution dates and amounts, ended at $956,013 with a 11.62% money-weighted return.
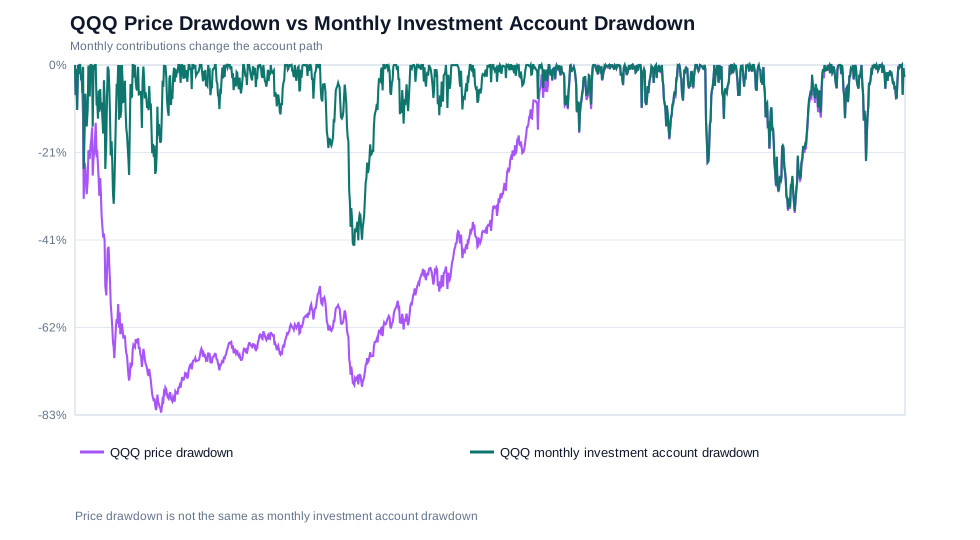
The early path still mattered. QQQ’s adjusted price fell -82.96% from its 2000 high to its 2002 trough, and did not recover that high until 2015-02-20. The QQQ contribution account’s last date below cumulative contributions was 2009-07-21. These are historical cash-flow results, not a statement about future returns.
Research Question
What happened to a monthly QQQ contribution account that started before the dot-com crash, and how did that cash-flow path compare with SPY monthly contributions over the same dates?
This is a narrower follow-up to the monthly contribution portfolio comparison. That article uses a common 2006 start date because it includes DBC. This note starts in 2000 and focuses only on QQQ and SPY.
Contribution Rule
monthly_contribution = $500
initial_capital = $0
contribution_date = first trading day of each calendar month
assets tested = QQQ and SPY
Each contribution buys the selected ETF using adjusted close. The model allows fractional shares and reinvested distributions through adjusted data.
Dot-Com Price Path
QQQ’s adjusted price path is separate from the contribution-account path. The table below shows the price-only stress period around the dot-com crash.
| QQQ 2000 high date | 2000-03-27 |
|---|---|
| QQQ 2000 high adjusted close | $99.22 |
| Trough date | 2002-10-09 |
| Trough adjusted close | $16.90 |
| Price drawdown from high | -82.96% |
| Recovery date | 2015-02-20 |
| Years to recovery | 14.9 |
The price series recovered its 2000 high much later than the contribution account recovered cumulative contributions. That difference comes from the later monthly purchases made at lower prices.
Results
| Metric | QQQ monthly contributions | SPY monthly contributions |
|---|---|---|
| Total contributed | $159,500 | $159,500 |
| Final value | $1,908,908 | $956,013 |
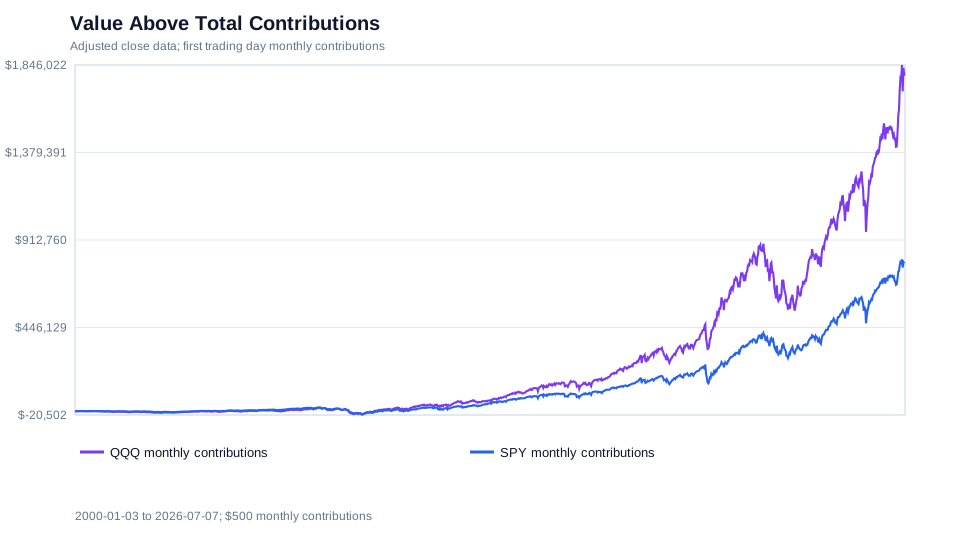
| Profit over contributions | $1,749,408 | $796,513 |
| Money-weighted return | 15.62% | 11.62% |
| Time-weighted CAGR | 8.59% | 8.26% |
| Annualized volatility | 26.79% | 19.30% |
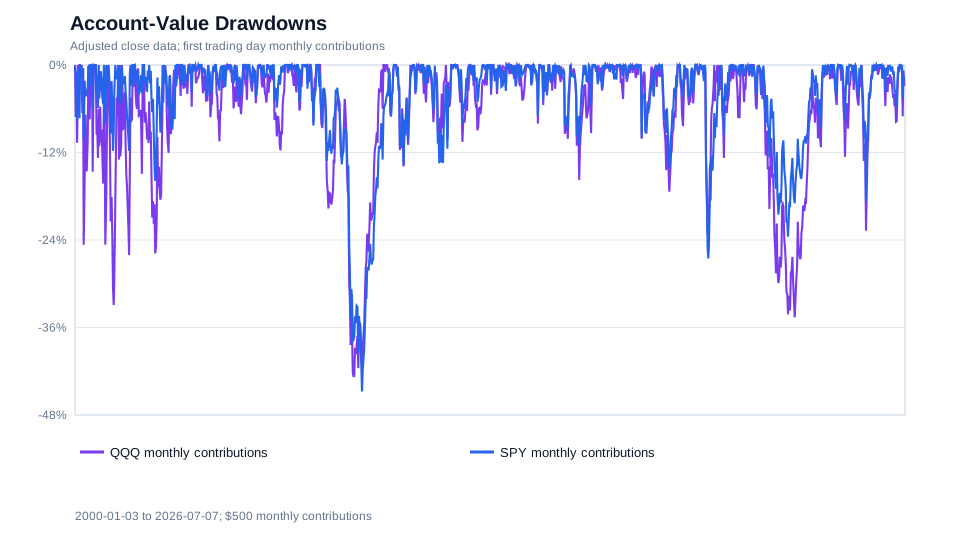
| Max account drawdown | -47.96% | -47.52% |
| Max price drawdown | -82.96% | -55.19% |
| Worst dollar loss vs contributions | -$18,537 | -$20,502 |
| Worst dollar loss date | 2008-11-20 | 2009-03-09 |
| Last date below contributions | 2009-07-21 | 2010-07-06 |
| Durable recovery date | 2009-07-22 | 2010-07-07 |
Interpretation
Starting monthly QQQ contributions in 2000 did not avoid a difficult early period. The QQQ account’s worst dollar loss versus cumulative contributions was -$18,537 on 2008-11-20. Its maximum account-value drawdown was -47.96%.
The price-only result was more severe: QQQ’s adjusted price fell -82.96% from the 2000 high to the 2002 trough and took about 14.9 years to recover that high. The monthly contribution account recovered cumulative contributions earlier because it kept buying during the lower-price period.
The comparison with SPY is not a general ranking. SPY had a lower final value in this sample, but it also had a different sector mix and return path. Both results depend on continuing contributions through the drawdowns.
Link to the Broader Contribution Study
The monthly contribution portfolio comparison uses a later common sample so it can compare SPY, QQQ, a 60/40 portfolio, and a simple multi-asset portfolio. This note uses a longer QQQ/SPY-only sample to show the dot-com crash period directly.
Limitations
This is a historical QQQ and SPY cash-flow test. It assumes the investor kept contributing through the crash, the 2008 financial crisis, and later drawdowns. Stopping contributions during the low-price period would produce a different path.
Adjusted close data is not an executable trading price. Yahoo Finance data can change after vendor revisions. The model excludes taxes, spreads, commissions, fund-level trading effects beyond adjusted returns, and real account constraints.
Money-weighted return depends on the contribution schedule. A different monthly amount, start date, or skipped contribution pattern can change the result.
Reproduce
cd studies/qqq-monthly-contributions-dot-com-crash
pip install -r requirements.txt
python3 -B -m unittest discover -s . -p "test_*.py"
python3 backtest.py
python3 plot.py
The output includes a summary CSV, daily audit CSV, price-stress CSV, and four SVG charts.
FAQ
Did monthly QQQ contributions avoid the dot-com crash?
No. The account still had a large drawdown and spent time below cumulative contributions. Monthly contributions changed the purchase path; they did not remove risk.
Why did the account recover before QQQ’s price recovered its 2000 high?
The account kept buying shares after prices fell. Those lower-cost shares changed the account break-even point.
Is this the same as comparing QQQ with a lump-sum investment?
No. This study tests a monthly cash-flow schedule. A lump-sum investment is a different question.
More notes
Monthly Contributions in SPY, QQQ, and ETF Portfolios
A reproducible monthly contribution backtest comparing SPY, QQQ, a 60/40 stock-bond portfolio, and a simple multi-asset ETF portfolio using adjusted-close data.
Relative vs Absolute Momentum in ETF Rotation
A reproducible ETF rotation backtest comparing relative momentum with an absolute momentum cash rule using the same multi-asset ETF universe, monthly rebalance schedule, and transaction-cost assumptions.