
Quick Take
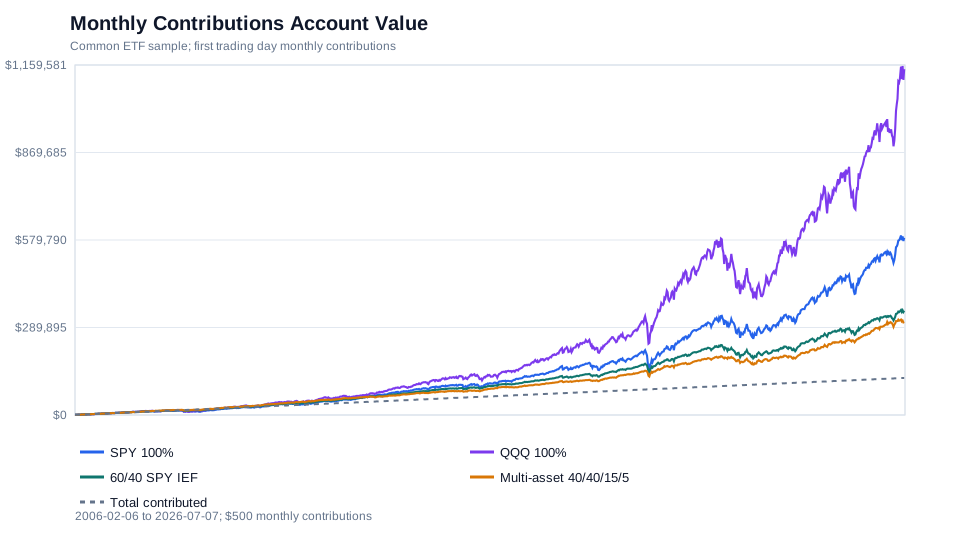
This note tests a fixed monthly contribution rule across four ETF portfolios. From 2006-02-06 through 2026-07-07, each portfolio receives $500 on each month’s first trading day, for total contributions of $123,000.
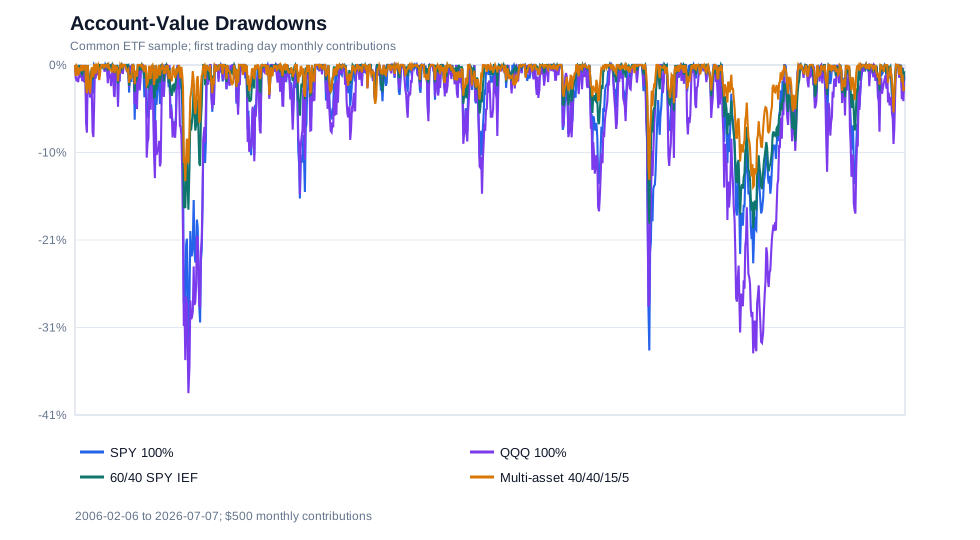
In this sample, QQQ had the highest final value, $1,104,193, and the deepest account-value drawdown, -41.12%. The multi-asset portfolio had a final value of $309,692 and an account-value drawdown of -14.92%. These are historical cash-flow results under the assumptions below, not a recommendation for any portfolio.
Research Question
How did fixed monthly contributions into SPY, QQQ, a 60/40 stock-bond portfolio, and a simple multi-asset ETF portfolio compare over the same yfinance data window?
This article uses a common 2006 start date so the multi-asset portfolio can include DBC. A separate QQQ monthly contribution study starting in 2000 focuses on the dot-com crash period directly.
Portfolios
| Portfolio | Target weights |
|---|---|
| SPY 100% | 100% SPY |
| QQQ 100% | 100% QQQ |
| 60/40 SPY IEF | 60% SPY, 40% IEF |
| Multi-asset 40/40/15/5 | 40% SPY, 40% IEF, 15% GLD, 5% DBC |
The multi-asset portfolio is intentionally simple. It is included as a different asset mix, not as an optimized allocation.
Contribution Rule
The backtest uses each month’s first available trading day as the contribution date:
monthly_contribution = $500
initial_capital = $0
contribution_date = first trading day of each calendar month
On each contribution date, the new cash is added and the full account is reset to the portfolio’s target weights. Between contribution dates, weights drift with daily adjusted-close returns.
Why Money-Weighted Return
This study has external cash flows. A simple ending-value CAGR would be misleading because the full contribution amount was not invested on the first day. The main return metric is therefore money-weighted return, calculated from dated contributions and final account value.
The table also includes a linked time-weighted CAGR. That metric describes the portfolio return path before external cash-flow sizing, while money-weighted return describes the investor cash-flow experience under this schedule.
Results
| Metric | SPY 100% | QQQ 100% | 60/40 SPY IEF | Multi-asset 40/40/15/5 |
|---|---|---|---|---|
| Total contributed | $123,000 | $123,000 | $123,000 | $123,000 |
| Final value | $588,229 | $1,104,193 | $345,609 | $309,692 |
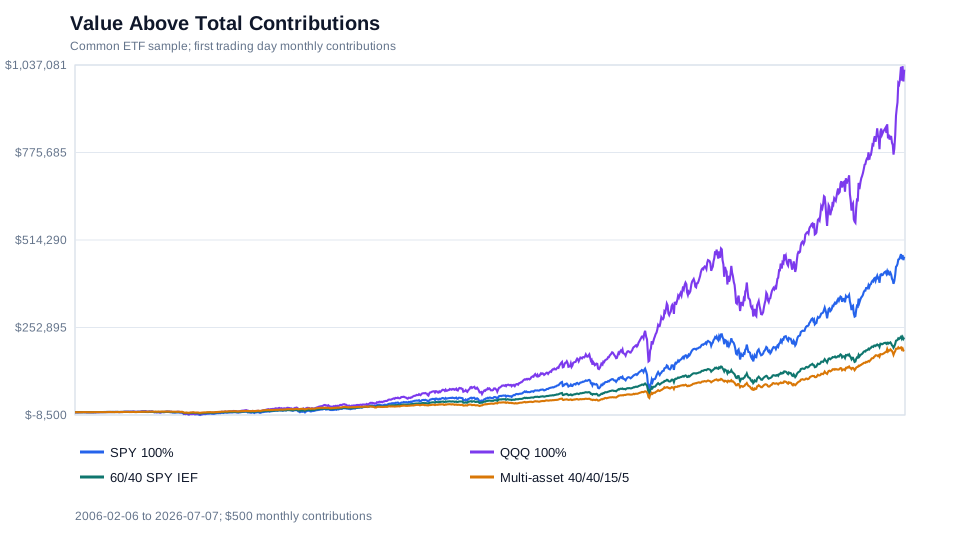
| Profit over contributions | $465,229 | $981,193 | $222,609 | $186,692 |
| Money-weighted return | 13.53% | 18.49% | 9.21% | 8.30% |
| Time-weighted CAGR | 11.12% | 15.91% | 8.28% | 7.82% |
| Annualized volatility | 19.30% | 21.98% | 10.85% | 8.53% |
| Sharpe (0% rf) | 0.64 | 0.78 | 0.79 | 0.93 |
| Max account drawdown | -36.02% | -41.12% | -19.38% | -14.92% |
| Contribution count | 246 | 246 | 246 | 246 |
Interpretation
The concentrated equity portfolios had higher ending values in this sample. QQQ ended at $1,104,193 and SPY ended at $588,229. Their account-value drawdowns were -41.12% and -36.02%, respectively.
The 60/40 portfolio ended at $345,609. The multi-asset portfolio ended at $309,692. Their account-value drawdowns were smaller in this sample, but their ending values were also lower than the 100% equity portfolios.
This is a cash-flow backtest, so the timing of contributions matters. Contributions made during lower-price periods bought more shares, while later contributions had less time to compound. The result should not be read as a general ranking of these portfolios.
Start-Year Sensitivity
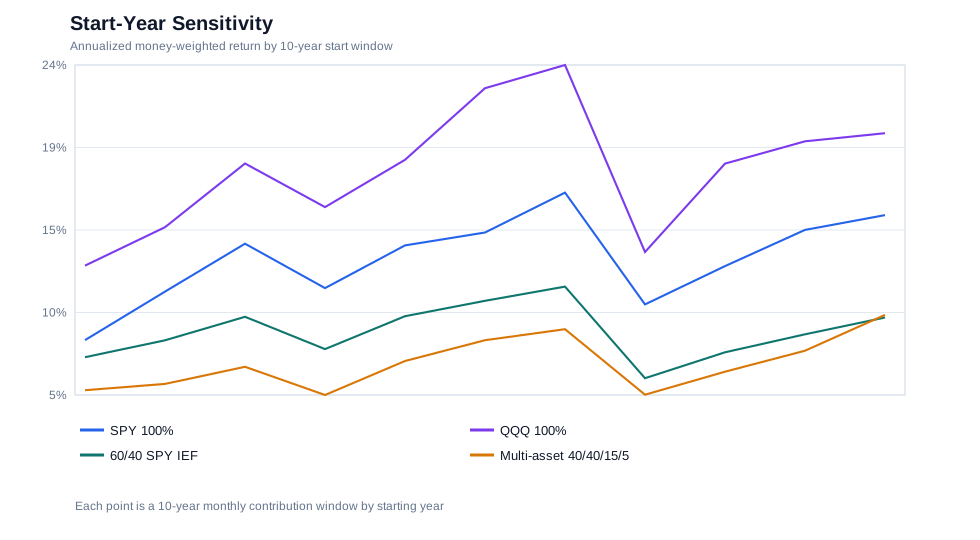
The table below reruns each portfolio over every available 10-year starting window. It reports the minimum, average, and maximum annualized money-weighted return across those windows, plus the range of final values.
| Portfolio | Min MWR | Avg MWR | Max MWR | Min final value | Max final value |
|---|---|---|---|---|---|
| SPY 100% | 8.45% | 12.99% | 16.71% | $93,386 | $144,132 |
| QQQ 100% | 12.62% | 17.99% | 23.86% | $116,443 | $211,998 |
| 60/40 SPY IEF | 6.31% | 8.92% | 11.45% | $82,947 | $108,747 |
| Multi-asset 40/40/15/5 | 5.37% | 7.14% | 9.86% | $79,004 | $100,519 |
This check is included because a monthly contribution result can be sensitive to the start date. A single full-period result mixes the asset return path with the cash-flow path.
Limitations
The common sample starts on 2006-02-06 because all five ETFs need valid adjusted-close data. SPY and QQQ have longer histories than this window, but using those longer histories would make the portfolio comparisons less direct.
Yahoo Finance adjusted data can change after vendor revisions. Adjusted close is not an executable trading price. The model ignores taxes, bid/ask spreads, commissions, fund trading frictions, fractional share limits, and any cash yield before each monthly investment.
Account-value drawdown is affected by ongoing contributions. It is useful for this cash-flow path, but it is not the same as drawdown on a lump-sum portfolio.
Reproduce
cd studies/monthly-contributions-spy-qqq-portfolio-backtest
pip install -r requirements.txt
python3 -B -m unittest discover -s . -p "test_*.py"
python3 backtest.py
python3 plot.py
The output includes a summary CSV, daily audit CSV, monthly contribution log, start-year sensitivity CSV, and four SVG charts.
FAQ
Is this a dollar-cost averaging study?
Yes. It models fixed monthly contributions into each portfolio. It does not compare monthly contributions with a lump-sum investment.
Why not use CAGR as the main return metric?
The account receives external cash flows. Money-weighted return is better aligned with dated contributions and final account value.
Does the portfolio rebalance?
Yes. On each monthly contribution date, the full account is reset to target weights. Between contribution dates, weights drift with returns.
Why does the sample start in 2006?
DBC is included in the multi-asset portfolio and has a shorter history than SPY and QQQ. The study uses a common window across all included ETFs.
More notes
Monthly QQQ Contributions Through the Dot-Com Crash
A reproducible backtest of monthly QQQ contributions starting in 2000, compared with SPY contributions and QQQ's dot-com price recovery path.
Relative vs Absolute Momentum in ETF Rotation
A reproducible ETF rotation backtest comparing relative momentum with an absolute momentum cash rule using the same multi-asset ETF universe, monthly rebalance schedule, and transaction-cost assumptions.