
Quick Take
31 trades over 33 years. Compared to buy and hold, the golden cross reduced volatility and drawdown but finished behind on ending wealth. Compared to a single 200-day SMA filter, it traded far less and earned more. It reads as a slow, low-maintenance risk filter, not a return enhancer.
Why the Golden Cross
The golden cross — when a shorter moving average crosses above a longer one — is one of the most quoted signals in technical analysis. I wanted to see what the classic 50-day / 200-day version actually does on SPY once the timing, costs, and benchmark are pinned down.
Method
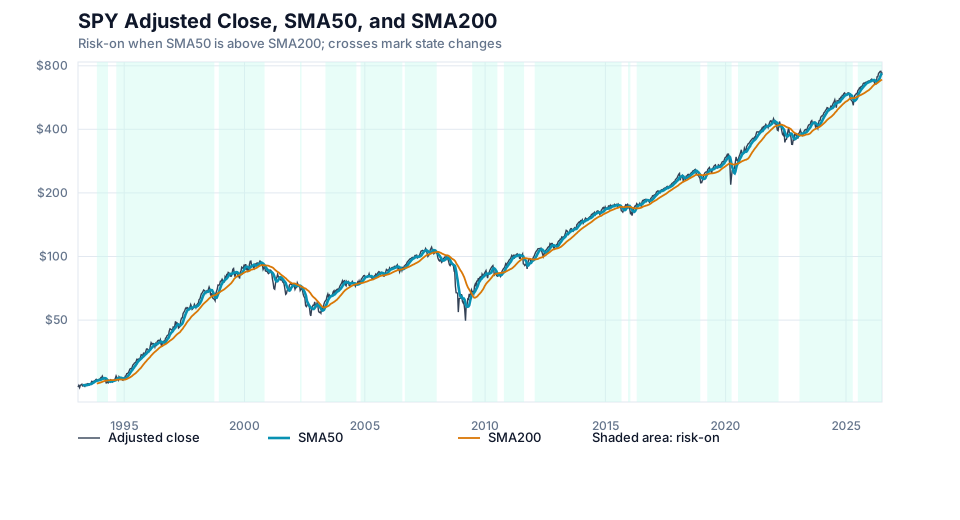
The backtest computes two simple moving averages from the daily adjusted close series. The strategy holds SPY when the prior day’s SMA50 is above the prior day’s SMA200, and holds cash otherwise.
I kept the same close-to-close model used in the single-SMA study, so the comparison is not mixing execution assumptions.
Data
| Field | Value |
|---|---|
| Source | Yahoo Finance via yfinance |
| Ticker | SPY |
| Price series | Adjusted close |
| Start date | 1993-01-29 |
| End date | 2026-07-02 |
| First valid SMA date | 1993-11-11 |
| Metric window | Includes the SMA warmup period |
| Initial capital | $10,000 |
| Base transaction cost | 5 bps per position change |
| Cash return | 0% |
The data/SPY.csv file is a local cache for this study. Running python3 backtest.py --refresh-data replaces it with fresh yfinance data.
Signal Definition
For each trading day t, the script computes:
SMA50[t]  = mean(adjusted_close[t-49] ... adjusted_close[t])
SMA200[t] = mean(adjusted_close[t-199] ... adjusted_close[t])
The position for day t uses only information available at the close of day t-1:
signal[t-1] = 1 if SMA50[t-1] > SMA200[t-1], else 0
position[t] = signal[t-1]
When SMA50[t-1] crosses above SMA200[t-1], it is a golden cross. When it crosses below, it is a death cross. The strategy does not trade only on crossover dates; the daily position is a state rule: hold SPY while SMA50 stays above SMA200, and switch to cash when the relationship flips. The first 200 trading days have no valid SMA200 and therefore produce no signal.
Execution and Cost Assumptions
The execution model is the same close-to-close approximation used in the single-SMA study. A signal based on the adjusted close of day t-1 determines the position for the interval from close t-1 to close t. This keeps the adjusted price series internally consistent, but it is not a next-open fill model.
The base case deducts 5 bps of portfolio equity each time the position changes, from cash to SPY or SPY to cash. At 31 trades across the full sample, the cost drag is far smaller than in the single-SMA study, where 215 position changes accumulated more friction.
Results
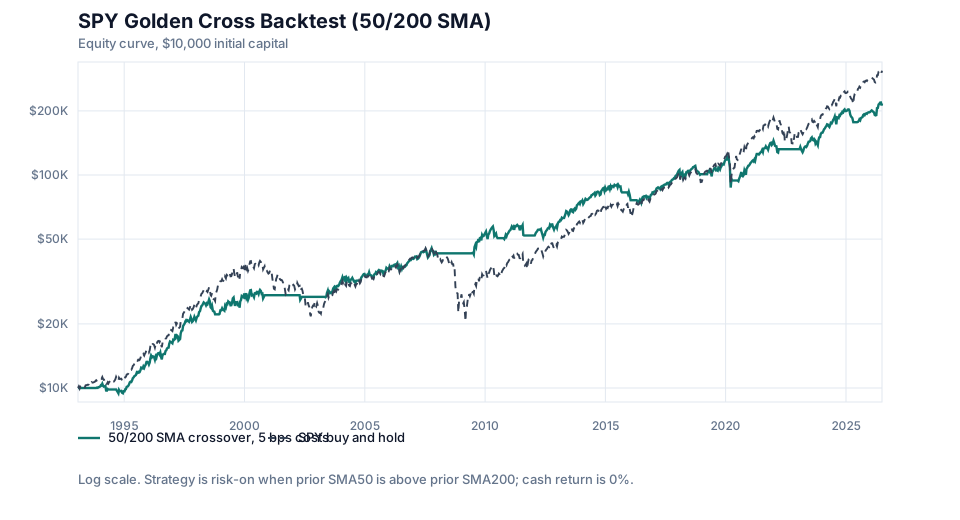
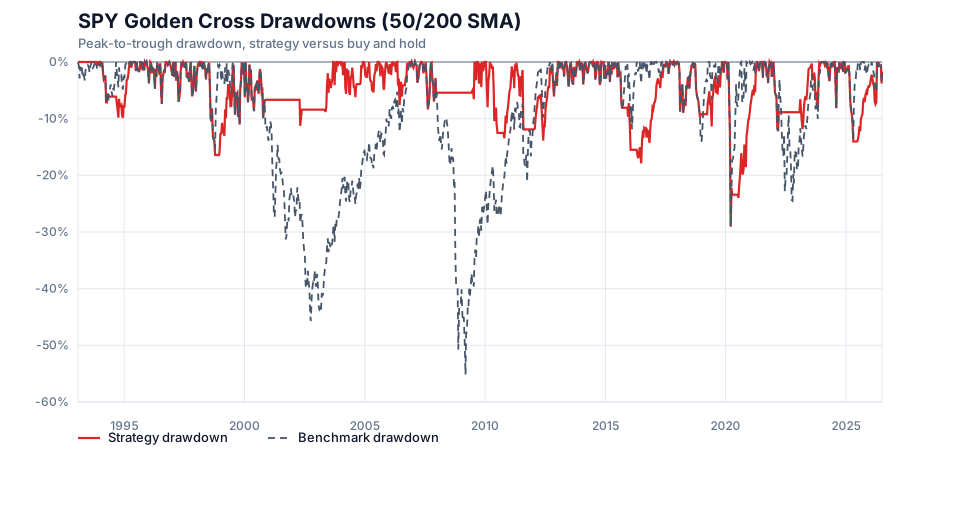
The golden cross earned a 9.64% CAGR, ahead of the single-SMA strategy’s 8.08% but still behind buy and hold’s 10.81%. Volatility and drawdown were both lower than the benchmark, though the strategy’s max drawdown of -33.72% was deeper than the single-SMA filter’s -29.42%.
The standout number is turnover. With only 31 position changes across 33 years, the golden cross is a very slow system. The trade count is close to one entry and one exit every two years.
| Metric | Strategy | Benchmark | Note |
|---|---|---|---|
| CAGR | 9.64% | 10.81% | 1993-01-29 to 2026-07-02 |
| Annualized volatility | 13.66% | 18.57% | Daily returns annualized with 252 trading days |
| Sharpe ratio | 0.74 | 0.65 | 0% risk-free rate |
| Max drawdown | -33.72% | -55.19% | Peak-to-trough equity drawdown |
| Calmar ratio | 0.29 | 0.20 | CAGR divided by absolute max drawdown |
| Time in market | 75.15% | 100.00% | Daily position average |
| Position changes | 31 | Initial buy only | Cash-to-SPY and SPY-to-cash changes |
| Final equity | $216,554 | $308,867 | $10,000 initial capital |
Interpretation
The golden cross trade count tells the story. 31 position changes over 33 years is a very different system from the single-SMA rule’s 215 changes. The slower crossover smooths out the whipsaw that can plague faster filters, and that shows up in the final wealth numbers. At $216,554, the golden cross strategy ends about 61% ahead of the single-SMA rule’s $134,111.
The cost side of that tradeoff is drawdown depth. The golden cross is slower to react to a reversal than a single moving-average filter. Because SMA50 must cross all the way through SMA200 before the rule exits, the strategy can stay invested through the start of a downturn. This is visible in the cost sensitivity table too: at only 31 trades, the spread between 0 bps and 10 bps costs is only about $6,700. Friction is not the binding constraint for this strategy. Signal lag is.
Robustness Checks
The main result uses 5 bps per position change. The table below reruns the same signal with 0 bps and 10 bps costs.
| Cost per position change | CAGR | Sharpe | Max drawdown | Final equity |
|---|---|---|---|---|
| 0 bps | 9.69% | 0.75 | -33.72% | $219,940 |
| 5 bps | 9.64% | 0.74 | -33.72% | $216,554 |
| 10 bps | 9.59% | 0.74 | -33.72% | $213,219 |
The cost sensitivity is small because the strategy rarely trades. At 31 total position changes, even doubling the assumed cost per trade does not change the story.
Comparison with the Single 200-Day SMA Rule
The single 200-day SMA study used a simpler filter: hold SPY when price is above SMA200, go to cash when it is below. That rule traded 215 times. The golden cross, with its second slower-moving SMA, traded 31 times. Here is a side-by-side comparison at the 5 bps base case.
| Metric | Golden cross (50/200) | Single SMA200 | Buy and hold |
|---|---|---|---|
| CAGR | 9.64% | 8.08% | 10.81% |
| Annualized volatility | 13.66% | 11.99% | 18.57% |
| Sharpe ratio | 0.74 | 0.71 | 0.65 |
| Max drawdown | -33.72% | -29.42% | -55.19% |
| Position changes | 31 | 215 | - |
| Final equity | $216,554 | $134,111 | $308,867 |
The difference in final wealth — $216,554 versus $134,111 — comes primarily from the golden cross staying invested during pullbacks that the single-SMA filter exited and re-entered. The price of that patience was a slightly deeper max drawdown. Whether patience or reactivity is the better trait depends on the market environment and the user’s objective.
Limitations
The execution model is the largest simplification. A close-to-close approximation is useful for a first test, but it overstates the quality of fills at the exact moment the crossover signal is generated. A next-open or one-day-delayed next-close model would be a more conservative follow-up.
Cash return at 0% also understates performance while the strategy is in cash during periods when short-term Treasury rates are high, as in the 2022-2024 window. Adding a Treasury bill proxy would close one of the larger gaps between this model and a real portfolio.
Reproducibility
Run the study from the research repository:
cd studies/spy-golden-cross
pip install -r requirements.txt
python3 backtest.py
python3 plot.py
python3 -m unittest discover -s . -p "test_*.py"
The generated files are:
| File | Purpose |
|---|---|
data/SPY.csv | Cached adjusted OHLCV from yfinance |
outputs/spy-golden-cross-summary.csv | Summary metrics for 0, 5, and 10 bps costs |
outputs/spy-golden-cross-equity.csv | Daily signal, position, returns, costs, equity, and drawdowns |
outputs/spy-golden-cross-trades.csv | Position-change log |
charts/spy-golden-cross-equity-curve.svg | Equity curve chart |
charts/spy-golden-cross-drawdowns.svg | Drawdown chart |
charts/spy-golden-cross-price-sma.svg | Adjusted close, SMA50, and SMA200 chart |
FAQ
What is a 50/200 SMA crossover strategy?
A 50/200 SMA crossover strategy compares the 50-day simple moving average with the 200-day simple moving average. In this test, SPY is held while SMA50 is above SMA200 and cash is held otherwise. The upward crossover is commonly called a golden cross; the downward crossover is a death cross.
Does the golden cross strategy beat buy and hold on SPY?
Not by ending wealth or CAGR in this version. Under the base assumptions, the strategy ended at $216,554 versus $308,867 for buy and hold. The tradeoff was lower volatility and a meaningfully smaller maximum drawdown.
How does the golden cross compare to a single 200-day moving average strategy?
In this sample, the golden cross earned a higher CAGR (9.64% vs 8.08%), traded far less (31 vs 215 position changes), and finished with much higher ending wealth ($216,554 vs $134,111). However, the single-SMA filter had a shallower max drawdown (-29.42% vs -33.72%). The golden cross is a slower, lower-turnover system; the single-SMA filter is more reactive.
Why use adjusted close data for SPY?
SPY pays distributions. Adjusted close accounts for dividends and stock splits, keeping the strategy and benchmark return series consistent.
How is look-ahead bias avoided in this backtest?
The signal is shifted before returns are applied. The position for day t uses SMA50[t-1] and SMA200[t-1], not any information from day t.
More notes
Monthly Contributions in SPY, QQQ, and ETF Portfolios
A reproducible monthly contribution backtest comparing SPY, QQQ, a 60/40 stock-bond portfolio, and a simple multi-asset ETF portfolio using adjusted-close data.
Monthly QQQ Contributions Through the Dot-Com Crash
A reproducible backtest of monthly QQQ contributions starting in 2000, compared with SPY contributions and QQQ's dot-com price recovery path.