
Quick Take
This is a small timing-detail study around the same SPY 200-day moving average rule. The moving average is always a 200-trading-day SMA. The only change is how often the signal is checked.
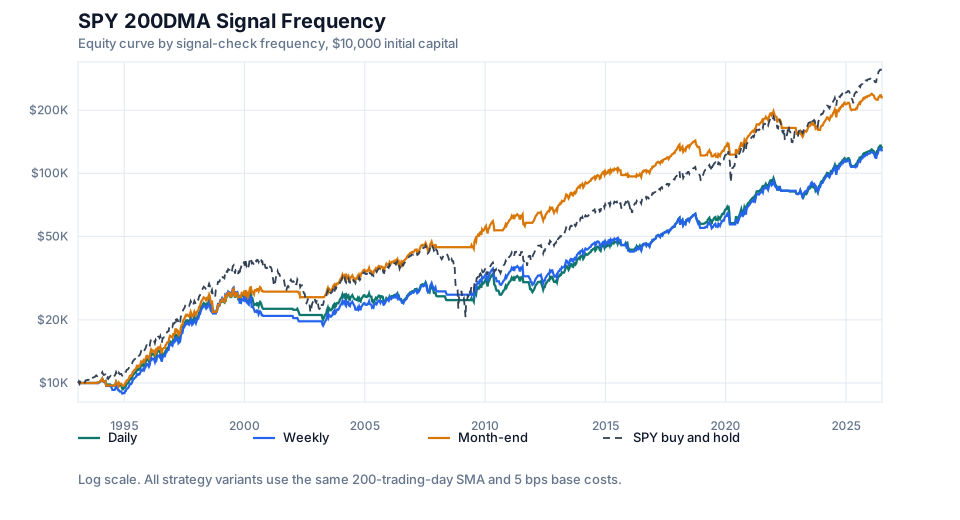
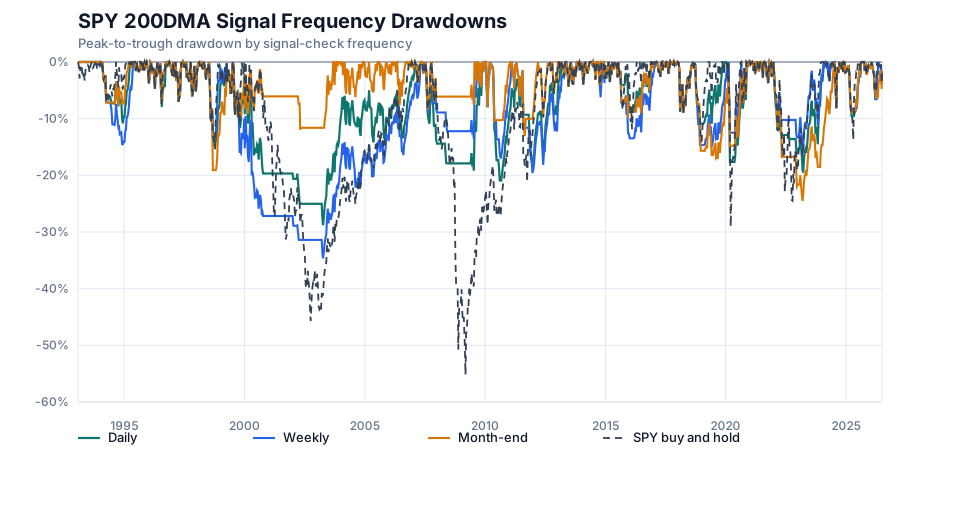
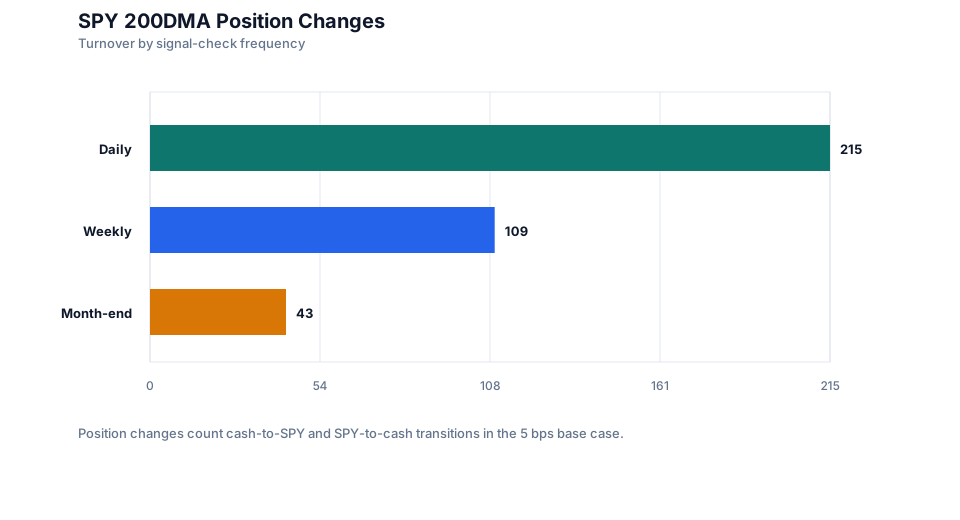
In this sample, checking less often did reduce position changes. Daily had 215 position changes, weekly had 109, and month-end had 43. That did not create one clean ordering across all metrics. Weekly had lower turnover than daily but a deeper drawdown. Month-end had the highest final equity of the three variants, but it is also a slower rule with different path risk.
I read the result as sensitivity evidence: the 200DMA rule is not just “the 200DMA rule.” The signal calendar matters.
Why Signal Frequency
Most descriptions of a SPY 200 day moving average backtest say something like “hold SPY above the 200-day moving average and hold cash below it.” That still leaves an implementation choice: how often do you check?
Checking every day reacts quickly, but it also sees every small cross around the moving average. Checking weekly or at month-end ignores some of that noise, but it also accepts more delay. This study isolates that choice while keeping the data, SMA length, benchmark, cost model, and execution approximation fixed.
Method
The backtest compares three versions of the same rule:
| Variant | Signal check |
|---|---|
| Daily | Every trading day |
| Weekly | Last available trading day of each week |
| Month-end | Last available trading day of each month |
All three variants compute the same daily SMA200 from adjusted close:
SMA200[t] = mean(adjusted_close[t-199] ... adjusted_close[t])This is not a 200-week or 200-month moving average test. The SMA is always based on 200 trading days; only the signal-check calendar changes.
Data
| Field | Value |
|---|---|
| Source | Yahoo Finance via yfinance |
| Ticker | SPY |
| Price series | Adjusted close |
| Start date | 1993-01-29 |
| End date | 2026-07-02 |
| First valid SMA200 date | 1993-11-11 |
| Metric window | Includes the SMA warmup period |
| Initial capital | $10,000 |
| Base transaction cost | 5 bps per position change |
| Cash return | 0% |
The script uses a local data/SPY.csv cache when present. Running python3 backtest.py --refresh-data replaces the cache with a fresh yfinance download.
Signal Definition
The daily version checks this condition every trading day:
raw_signal[t] = 1 if adjusted_close[t] > SMA200[t], else 0
signal[t] = raw_signal[t]
position[t] = signal[t-1]
The weekly version checks the same condition only on the last trading day of each week. Other days carry forward the last checked signal:
raw_signal[t] = 1 if t is the week's last trading day and adjusted_close[t] > SMA200[t]
signal[t] = last non-missing raw_signal
position[t] = signal[t-1]
The month-end version does the same thing on the last trading day of each month:
raw_signal[t] = 1 if t is the month's last trading day and adjusted_close[t] > SMA200[t]
signal[t] = last non-missing raw_signal
position[t] = signal[t-1]
The first 199 trading days have no valid SMA200, so they cannot produce a risk-on signal.
Execution and Cost Assumptions
This study uses the same close-to-close same-close approximation as the earlier daily 200DMA study. A signal checked at the close of day t-1 determines the modeled position for the close t-1 to close t return interval.
The important timing point is that a signal update date is not used for that same close-to-close return. The code computes position = signal.shift(1) for all variants.
Results
At 5 bps per position change, month-end had the highest CAGR, highest final equity, and shallowest max drawdown in this sample. Daily traded the most, while weekly reduced turnover but had a deeper drawdown than daily.
| Metric | Daily | Weekly | Month-end | SPY buy and hold |
|---|---|---|---|---|
| CAGR | 8.08% | 7.98% | 9.88% | 10.81% |
| Annualized volatility | 11.99% | 11.98% | 12.56% | 18.57% |
| Sharpe ratio, 0% rf | 0.71 | 0.70 | 0.81 | 0.65 |
| Max drawdown | -29.42% | -34.65% | -25.73% | -55.19% |
| Calmar ratio | 0.27 | 0.23 | 0.38 | 0.20 |
| Time in market | 75.35% | 75.09% | 75.63% | 100.00% |
| Position changes | 215 | 109 | 43 | Initial buy only |
| Final equity | $134,111 | $130,145 | $232,962 | $308,867 |
Interpretation
The cleanest result is turnover. Daily checking caught many more small crosses around the SMA200. Weekly checking cut the number of position changes roughly in half, and month-end checking cut it much further.
The performance path is less clean. Weekly checking had fewer trades than daily, but it ended slightly lower and had a deeper max drawdown. Month-end checking looked better in this historical sample, but that does not establish a general ranking. It means this particular calendar avoided some daily whipsaw without being badly late in the major episodes that mattered most for this sample.
That is a useful distinction. Signal frequency changes both friction and timing. Lower turnover helps only if the ignored signals are mostly noise; it can hurt when the ignored signals contain useful information.
Robustness Checks
The table below reruns each variant at 0, 5, and 10 bps per position change.
| Variant | Cost | CAGR | Sharpe | Max drawdown | Position changes | Final equity |
|---|---|---|---|---|---|---|
| Daily | 0 bps | 8.43% | 0.74 | -28.00% | 215 | $149,340 |
| Daily | 5 bps | 8.08% | 0.71 | -29.42% | 215 | $134,111 |
| Daily | 10 bps | 7.73% | 0.68 | -30.82% | 215 | $120,429 |
| Weekly | 0 bps | 8.16% | 0.72 | -33.99% | 109 | $137,439 |
| Weekly | 5 bps | 7.98% | 0.70 | -34.65% | 109 | $130,145 |
| Weekly | 10 bps | 7.80% | 0.69 | -35.31% | 109 | $123,234 |
| Month-end | 0 bps | 9.95% | 0.82 | -25.51% | 43 | $238,010 |
| Month-end | 5 bps | 9.88% | 0.81 | -25.73% | 43 | $232,962 |
| Month-end | 10 bps | 9.81% | 0.81 | -25.95% | 43 | $228,019 |
The cost sensitivity mostly follows turnover. Daily has the widest spread between 0 and 10 bps because it changes position 215 times. Month-end has the smallest cost drag because it changes position 43 times.
Comparison with the Daily 200DMA Study
The daily variant here is the same rule as the earlier SPY 200-day moving average backtest: adjusted close above daily SMA200, lagged one day, 5 bps base cost, cash at 0%.
That gives a useful anchor. The earlier study asked what the basic daily rule did. This study asks whether the result is sensitive to the signal calendar. The answer is yes. Using the same 200DMA, the base-case final equity ranged from $130,145 for weekly checks to $232,962 for month-end checks, while the daily version ended at $134,111.
Limitations
The execution model is still a simplification. A close-to-close approximation keeps the adjusted close return series internally consistent, but it is not a next-open fill model.
Cash earns 0%, which understates cash-period returns during higher-rate periods. Taxes, account constraints, bid/ask spreads, market impact, and intraday order behavior are not modeled.
The month-end 200 day moving average strategy variant also depends on the historical calendar path. A different asset, sample window, cash proxy, or execution model could change the ranking across daily, weekly, and month-end checks.
Reproducibility
Run the study from the research repository:
cd studies/spy-200-day-moving-average-signal-frequency
pip install -r requirements.txt
python3 -B -m unittest discover -s . -p "test_*.py"
python3 backtest.py
python3 plot.py
The generated files are:
| File | Purpose |
|---|---|
data/SPY.csv | Cached adjusted OHLCV from yfinance |
outputs/spy-200dma-signal-frequency-summary.csv | Summary metrics for all variants and 0/5/10 bps cost scenarios |
outputs/spy-200dma-signal-frequency-equity.csv | Base-case daily signal, position, returns, costs, equity, and drawdowns |
outputs/spy-200dma-signal-frequency-trades.csv | Base-case position-change log |
charts/spy-200dma-signal-frequency-equity-curve.svg | Equity curve comparison |
charts/spy-200dma-signal-frequency-drawdowns.svg | Drawdown comparison |
charts/spy-200dma-signal-frequency-position-changes.svg | Position-change comparison |
Only the summary CSV and SVG charts are copied into this site. The full equity and trade CSVs are generated by the code above.
FAQ
Is this a 200-week or 200-month moving average strategy?
No. It is always a 200-trading-day simple moving average. Weekly and month-end refer only to how often the daily SMA200 signal is checked.
How is the weekly signal calculated?
The script identifies the last available trading day in each week. On that date, it checks whether adjusted close is above the daily SMA200. The resulting signal is carried forward until the next weekly check, and the position is shifted by one trading day.
How is the month-end signal calculated?
The script identifies the last available trading day in each calendar month. On that date, it checks whether adjusted close is above the daily SMA200. The resulting signal is carried forward until the next month-end check, and the position is shifted by one trading day.
Does checking less often reduce whipsaw?
It reduced position changes in this sample: 215 for daily, 109 for weekly, and 43 for month-end. That is evidence of lower turnover, but it is not a guarantee of better results. Weekly had lower turnover than daily and still had a deeper max drawdown in this run.
How is look-ahead bias avoided?
The code separates signal and position. A signal checked on day t is not used for the return ending on day t. The modeled position is always signal.shift(1), so returns use only prior-day or older information.
More notes
Monthly Contributions in SPY, QQQ, and ETF Portfolios
A reproducible monthly contribution backtest comparing SPY, QQQ, a 60/40 stock-bond portfolio, and a simple multi-asset ETF portfolio using adjusted-close data.
Monthly QQQ Contributions Through the Dot-Com Crash
A reproducible backtest of monthly QQQ contributions starting in 2000, compared with SPY contributions and QQQ's dot-com price recovery path.